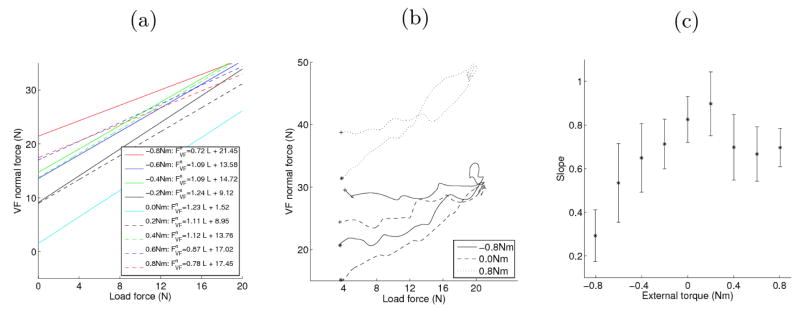
Figure 4.
The increase in VF normal force with an increase in the load. (a) Regression lines showing the increase in the VF normal force with an increase in the load, for a typical subject (b) Hysteresis loops for 3 external torque conditions for a typical subject. The (*) indicates the beginning of the trial, and the (+) the end of the trial. (c) The mean and standard error of the slope of the normal force vs. the load force, averaged across subjects, as a function of the torque for the force increase.

