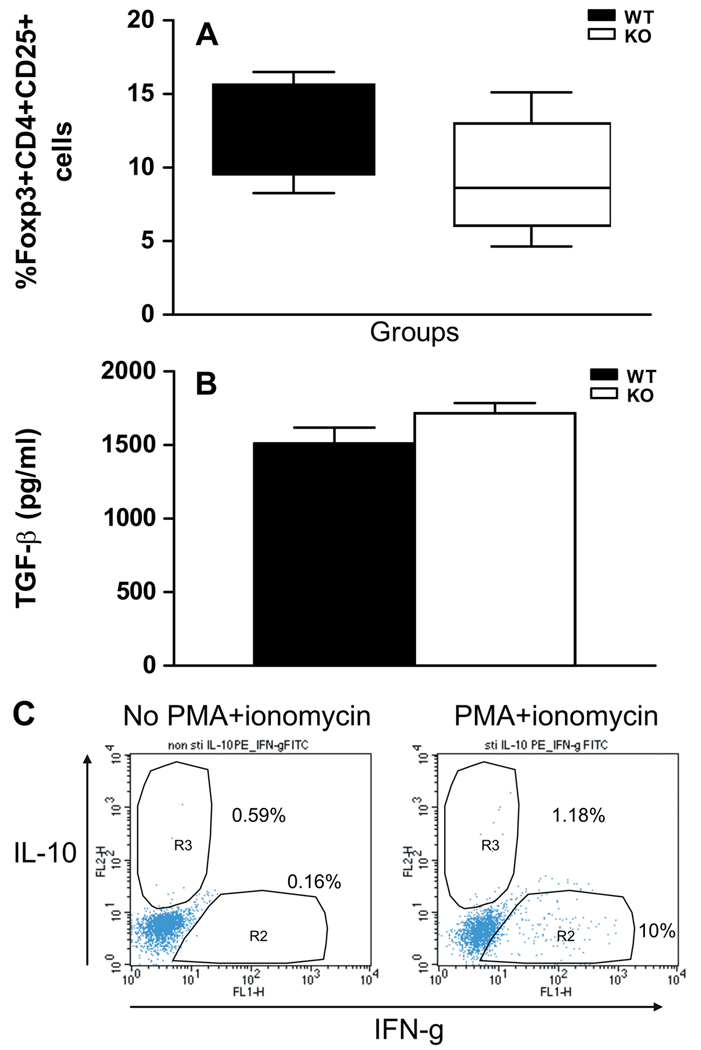
Figure 5.
IL-4 suppression of responses to CYP2E1 does not involve regulatory T cells. (A) The percentages of Foxp3+CD4+CD25+ T cells were not significantly different in KO (9.4 ± 4.0%) when compared to WT (12.3 ± 3.2%) mice (Mean ± SEM of pooled data from individual mice. Experiments were run in duplicate with N = 4 mice/group). (B) TGF-β levels were not significantly different in splenocytes isolated from KO (1716 ± 156.3pg/ml) or WT (1511 ± 241.6pg/ml) mice and re-stimulated for 72h with 10µg/ml CYP2E1 Mean ± SEM of pooled data from individual mice. Experiments were run in duplicate with N = 5 mice/group. (C) Representative flow cytometric analysis of intracellular IL-10 and IFN-γ levels in splenocytes isolated from TFA-S100 – immunized KO mice and activated with PMA and ionomycin. No IFN-γ and IL-10 double positive cells were detected, although IFN-γ single positive and a few IL-10 single positive cells were seen.

