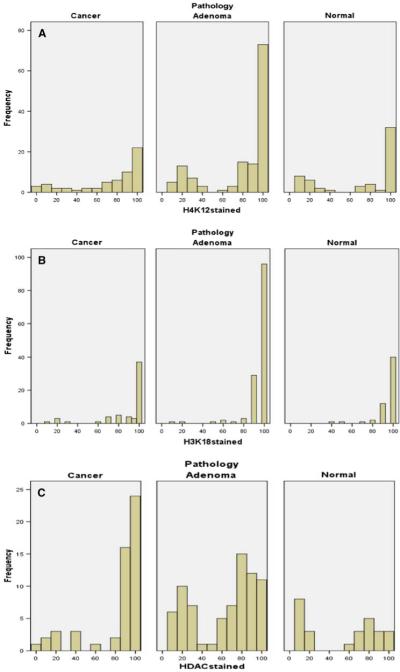
Fig. 2.
Distribution of staining for acetylated histones and HDAC2 in colon cancers moderate to well differentiated, adenomas, and normal colon. Data are summarized across all 250 tissue samples for H4K12 (a), H3K18 (b), and HDAC2 (c). The y axis shows the fraction of samples with positive staining for the indicated percentage of cells (x axis)

