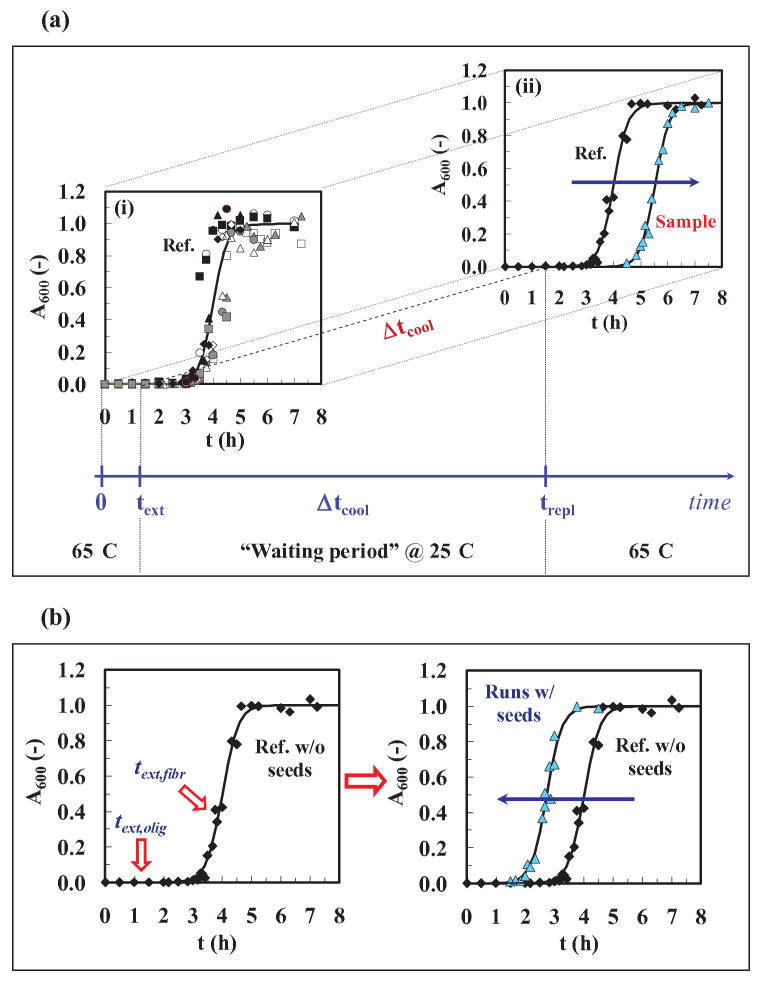
Figure 1.
Protocols for the experiments: (a) The cooling experiment. (1) text (extraction time) to remove samples from the heater at 65±2°C and pH 1.6 (1.5 h was the time chosen). (2) Δtcool (cooling time at 25±2°C and pH 1.6) for different times up to 28 days, and (3) trepl (replacement time) to replace the cooler samples into 65±2°C and pH 1.6. For graph (i), the standard kinetic curve ( ) was obtained by fitting Eq. (2) to averaged data from twelve different runs. The values of the parameters from the model fit using Eq. (2) were: tlag = 3.47 h, t50 = 4 h, kapp = 3.76 h-1 (R2=0.983). For graph (ii), we used averaged data for the standard kinetic experiment (◆) and for cooled and re-heated samples (
 ). (b) The seeding experiment. (1) Left figure: text,olig/fiber (extraction time for oligomer or fiber) is the time at which samples are removed from a run at 65±2°C and pH 1.6, and (2) Right figure: sigmoidal curves with and without seeds. Averaged data were used for the standard kinetic experiment (◆) and for a seeded run (
 ). Model fits using Eq. (2) (
 ).
).

