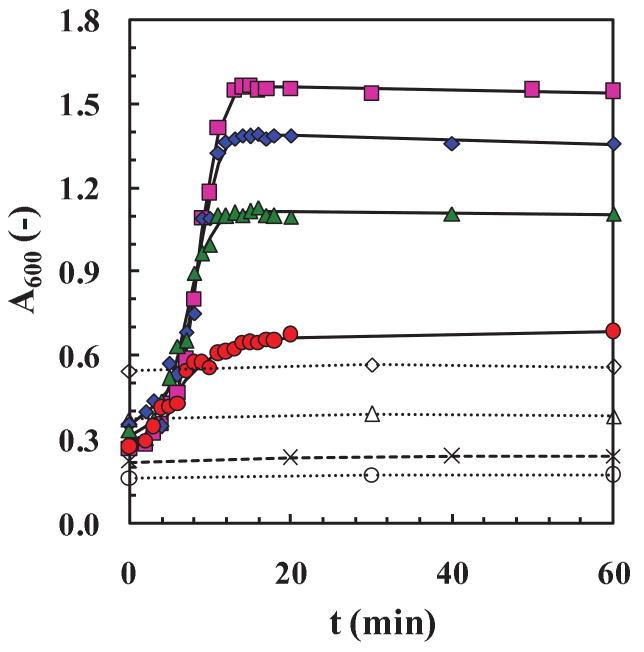
Figure 10. Seeding with oligomers or fibrils (total insulin concentrations were not kept constant).
Two different data sets are shown here in terms of absolute absorbance readings, A600, versus time, t. For the first set, different amounts of dissolved fresh insulin at 40 mg ( ), 30 mg (
 ), 20 mg (
 ), 10 mg (
 ) and 0 mg (×) (control experiment) were added to the same amount (∼ 2 mg) of pre-washed fibrils, collected at the end of a previous fibrillation run. Fits (
 ) were obtained using Eq. (2) from the empirical model. For the second set, the same washed fibrils were added to new pre-washed fibrils, collected at different times during the elongation phase at times: 3.5 h (○), 3.8 h (△) and 4 h (◇) or at 15, 34, and 50 % of the A600,asym values, respectively. All the samples were placed at 65±2°C and pH 1.6. For each run 8 mg of fibers were resuspended in 20 ml of fresh buffer.

