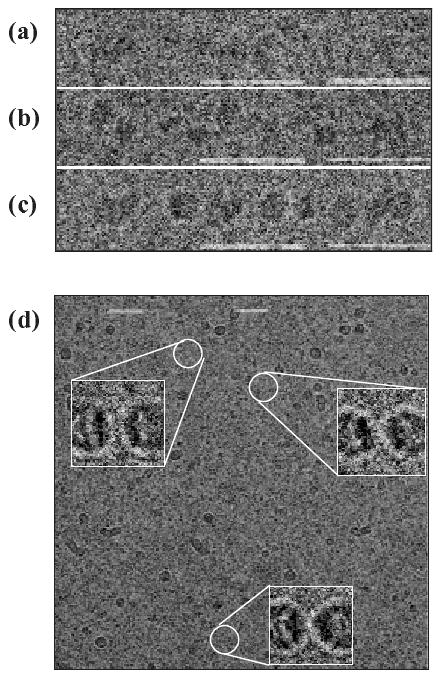
Figure 2.

Gallery of electron cryo-microscopy of selected insulin oligomers, collected at different time points during the standard fibrillation process and prior to the unset of fibril formation: (a) 0, (b) 1.5 and (c-d) 3 hours. Inserts in (d) are enlargement by ∼ 4 times. Bar size = 50 nm.
