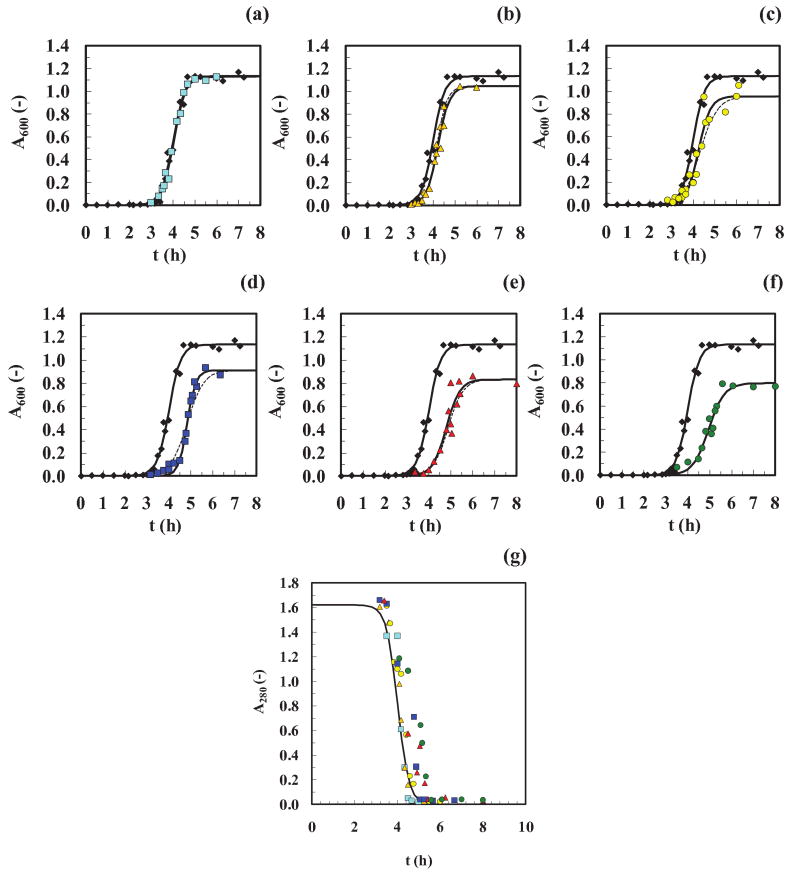
Figure 3. Cooling experiments (single extraction time).
Absolute absorbance readings (not normalized) are shown for (a-f) A600 and (g) A280. Reference data (◆ and ( ) in graphs (a-f) and (g), respectively), data after a Δtcool of 1 day (
 ), 4 days (
 ), 7 days (
 ), 14 days (
 ), 21 days (
 ), 28 days (
 ). All the runs have been shifted to the right by text = 1.5 hours. Fits of the data, using Eq. (2) (
 ) and Eq. (3) (
 ), are displayed in the graphs (a-f) showing good agreement with the experimental data. Goodness-of-fit are given in the legend of Fig. S1. (g) The initial insulin concentration for all the samples (prepared from the same batch) was ∼2 mg/ml. The following linear calibration curve was used in the range 0.0-2.0 mg/ml of dissolved insulin: A280 = 0.810 · c, (R2=0.999).

