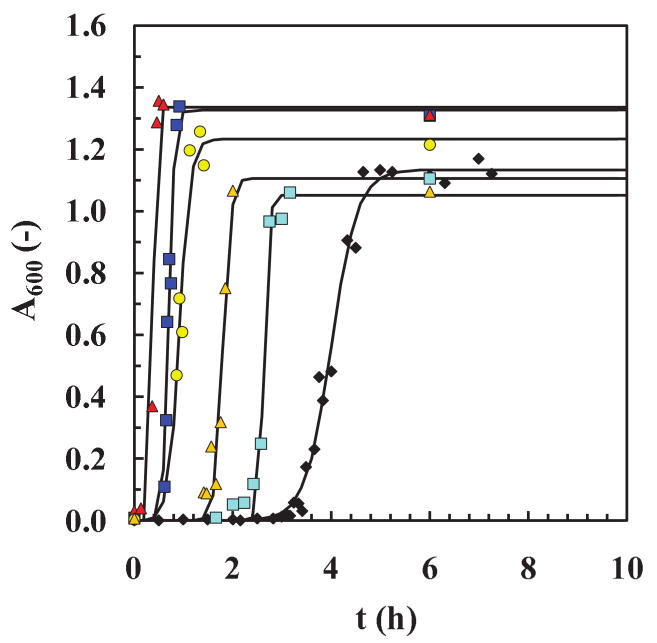
Figure 8. Seeding experiments (with oligomers).
Samples comprising 2% by volume were taken at increasing times, text,i, during an insulin fibrillation run prior to the formation of fibrils and added as seeds to fresh new insulin runs (total insulin concentration was kept at 2 mg/ml, 65±2°C and pH 1.6). Sigmoidal plots of the fibrillation process for A600 versus time, t, in hours. Reference data (no seeds added) (◆) and data with seeds extracted at text,i of 0.5 h ( ), 1 h (
 ), 2 h (
 ), 2.5 h (
 ), 3 h (
 ). Fits (
 ) were obtained using Eq. (2) from the empirical model.

