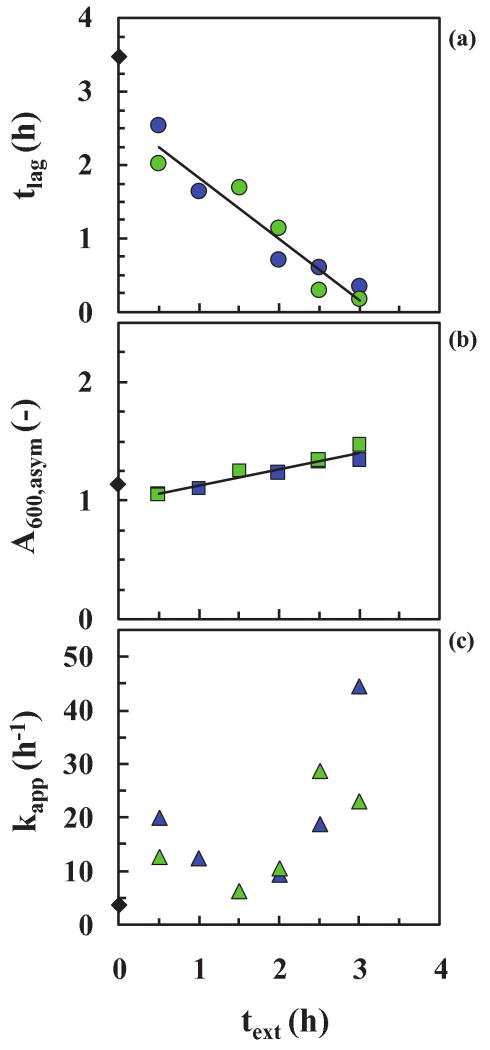
Figure 9. Seeding experiments (with oligomers).
Parameters resulting from a best fit of Eq. (2) to the data in Fig. 7: (a) tlag, (b) A600,asym and (c) kapp as a function of the extraction time, text,i. Reference data (without seeding) (◆) and seeding experiments using 2% v/v ( ,
,  and
and  , respectively) and 10% v/v (
 ,
,  and
and  , respectively) seeds (total insulin concentration was kept at 2 mg/ml, 65±2°C and pH 1.6). The linear fits (
 ), tlag = −0.831x + 2.652, (R2=0.923) and A600,asym = 0.138text + 0.988, (R2=0.917). The relative decrease in tlag, and increase in A600,asym after 3 hours were 93% and 24%, respectively.

