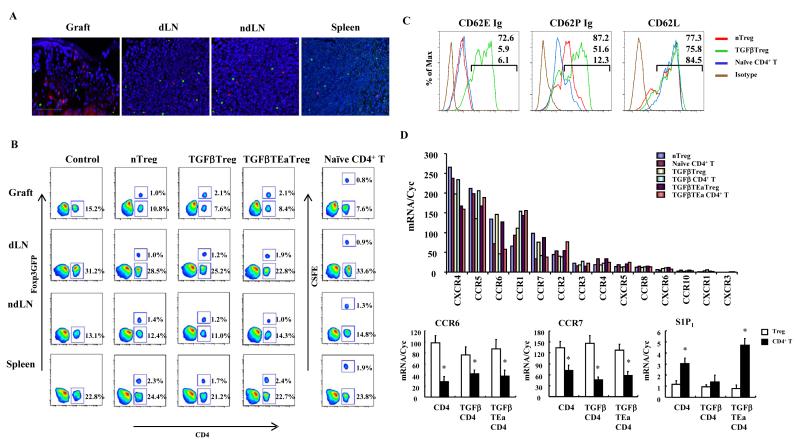
Figure 1. Treg migration to islet allografts and lymphoid tissues.
(A) 1×10⁶ nTreg labeled with PKH26 and intravenously transferred to Foxp3GFP islet allograft recipients at the time of transplantation. Grafts, dLN, peripheral axillary LN, and spleens harvested and sectioned 4 days later. Adoptively transferred Treg (red) and endogenous Treg (green) shown by fluorescent microscopy. Pictures representative of 10 sections/sample from 3 mice. Magnification x100. (B) 1×10⁶ nTreg, TGFβTreg or TGFβTEaTreg from Foxp3GFP mice or CSFE labeled naïve CD4+CD25- T cells intravenously transferred to recipients on the day of transplantation. Four days after transplantation, grafts, dLN, ndLN and spleen were isolated, and T cell migration with pooled samples from 2 mice/group analyzed with flow cytometry. Results are gated on CD3+ cells and representative of 3 independent experiments. (C) Comparison of CD62E ligand, CD62P ligand and CD62L expression on T cell subsets (gated on CD4+Foxp3GFP+ cells). Results representative of 3 independent experiments. Gating on CD4+GFP+or CD4+GFP- population. (D) qRT-PCR analysis of chemokine receptor and S1P1 expression in T cell subsets from Foxp3-GFP mice. Freshly isolated nTreg or naïve CD4+ T cells, or cells stimulated in culture and Treg and non-Treg CD4+ subsets separated by GFP expression. Results representative of 3 independent experiments. (*p<0.05 compared to counterpart Treg group).

