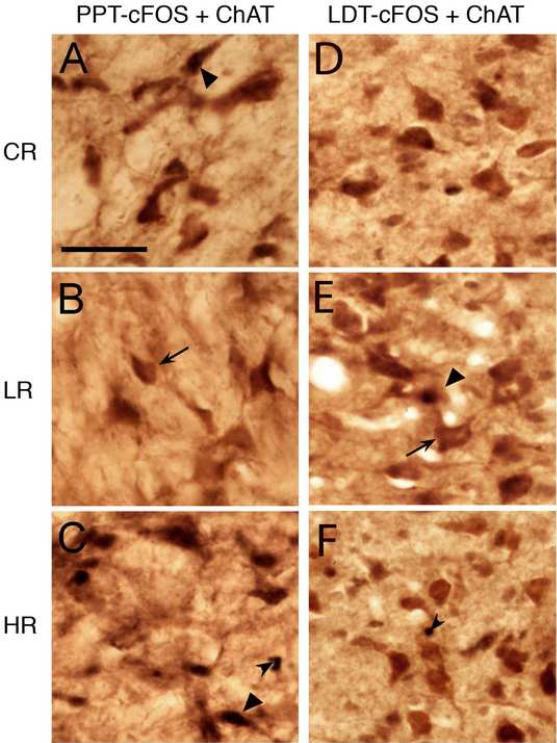
Figure 3.
Photomicrographs showing representative examples of ChAT-positive (ChAT+, arrows), c-Fos-positive (c-Fos+, small arrow head), and ChAT+ and c-Fos+ (ChAT+/c-Fos+, large arrow head) cells in the pedunculopontine tegmental nucleus (PPT, A-C) and laterodorsal tegmental nucleus (LDT, D-F) in animals sacrificed after control/baseline REM sleep (CR, A and D), low REM sleep (LR, B and E), and high REM sleep (HR, C and F) conditions. Scale bar in A for A-F = 100 μm.

