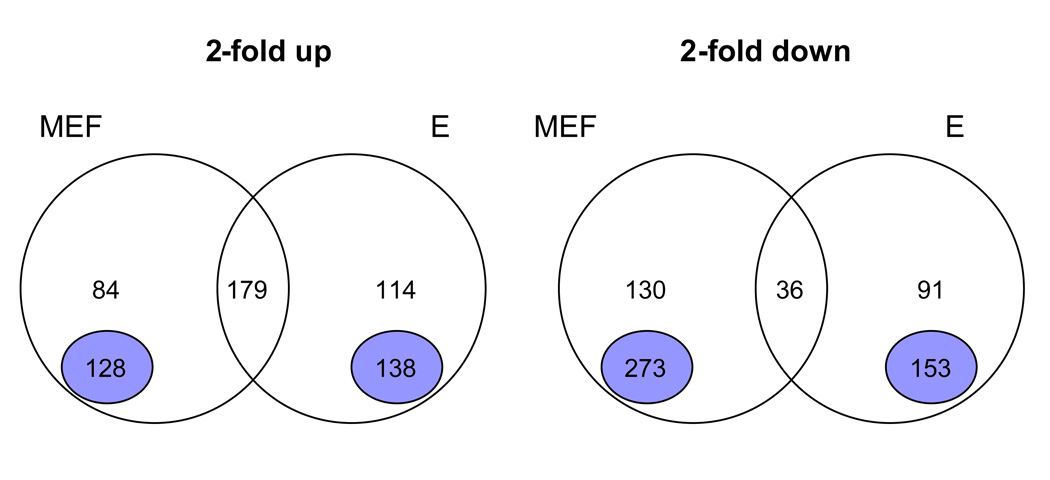
Fig 2.
Analysis of SV40 regulated genes in MEFs and enterocytes. The intersection of the genes that were 2-fold up or 2-fold down in the MEF and enterocyte (E) microarrays were overlapped and visualized by Venn Diagrams. The number of genes in each set is indicated. The number above the purple circle represent genes that were regulated by array (1.2- to 2-fold) in the other class but did not meet the 2-fold cutoff. Uniquely regulated genes are indicated by the purple circle. These genes show either no regulation in the other class or are oppositely regulated. For instance, the 128 uniquely upregulated genes in transformed MEFs are less than 1.2-fold upregulated in transformed enterocytes.

