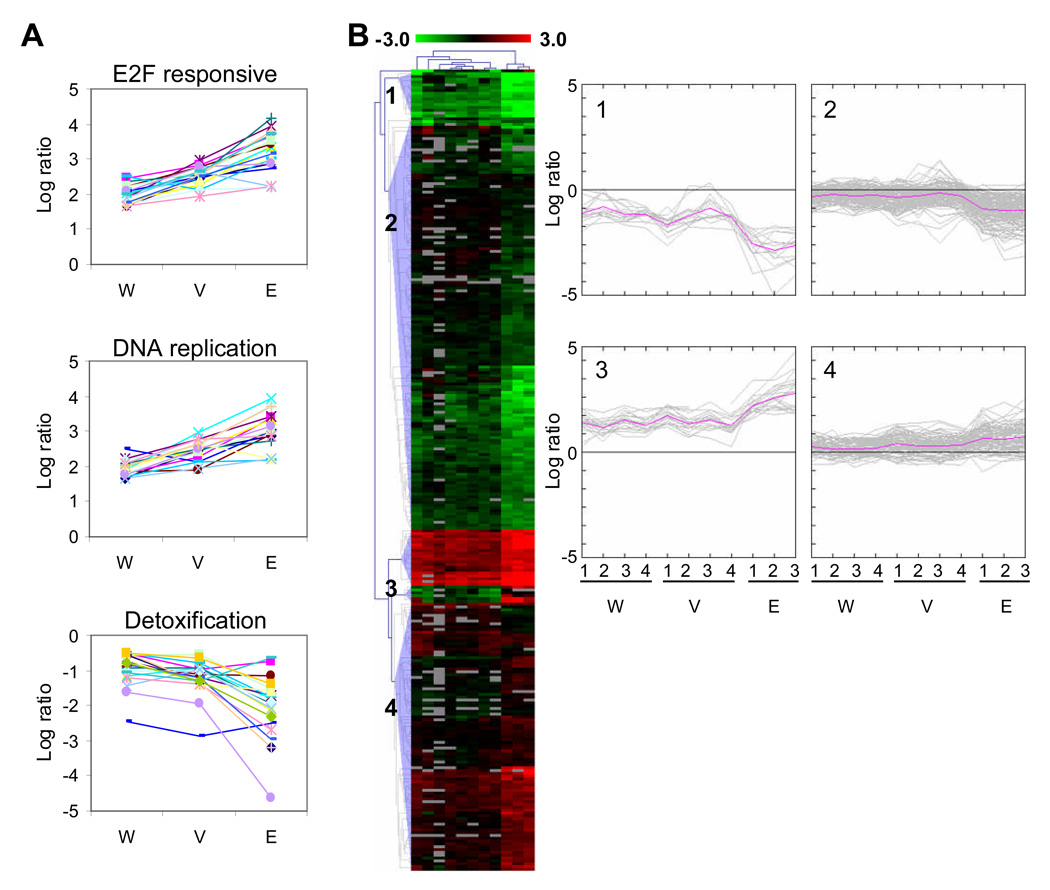
Fig 5.
Mouse intestine microarrays show similar patterns of gene expression. (A) The average log ratio of E2F responsive genes that were upregulated 3-fold or more in the whole intestine (W), fractionated villi (V) and LCM extracted enterocyte (E) arrays is shown in the top panel. Similarly, the middle panel shows DNA replication genes upregulated at least 3-fold. In the bottom panel, detoxification genes that are downregulated 1.4-fold or more are shown. (B) The biological replicates of the whole intestine, fractionated villi and enterocyte microarray data were filtered by ANOVA (p=0.01) which resulted in 284 clones. These clones were hierarchically clustered using the Euclidean distance metric and average linkage. Clones are colored red and green for clones that are up and downregulated in SV40-transformed tissue, respectively. Grey clones represent missing data. Four expression patterns were revealed from the cluster diagram and the log ratio values of these clones are plotted on the right. The pink line represents the average log ratio for the set of clones in each biological replicate.

