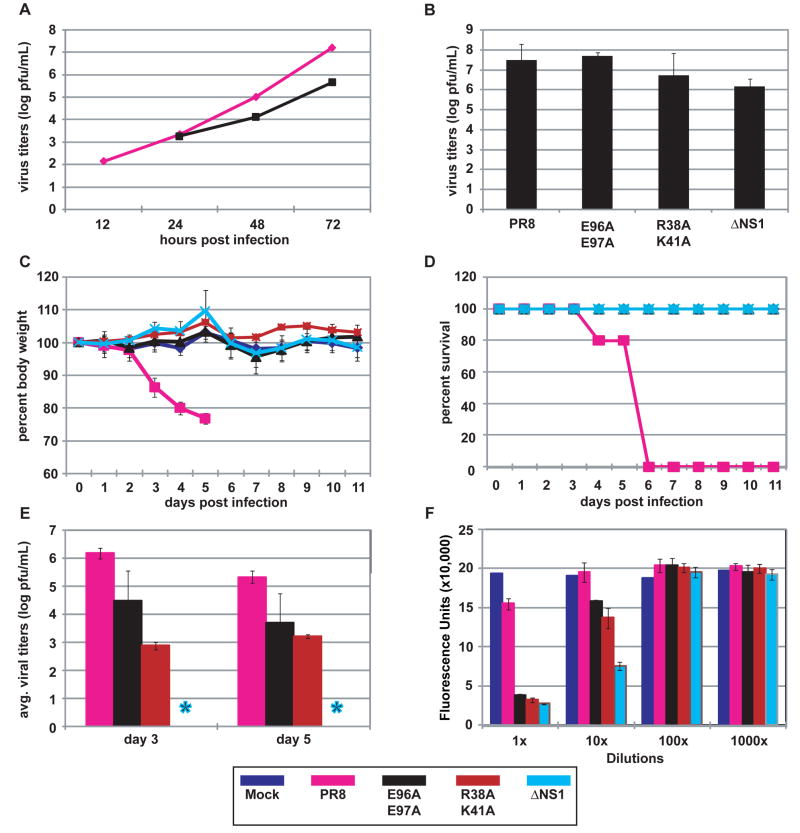
Fig. 4. Replication and pathogenicity of recombinant influenza viruses.
(A) Multicycle replication of recombinant influenza viruses in A549 cells infected at an MOI of 0.001 pfu per cell. (B) Virus production from interferon-deficient 8-day old embryonated chicken eggs at 24 h post-infection with 100 pfu of each virus per egg. (C) Percent body weight loss of mice following virus infection. Female Balb/C (n = 5) were infected intranasally with 1x10⁴ pfu of one of the indicated viruses or mock-infected with PBS. Body weights were measured for 12 consecutive days following infection. (D) Kaplan-Meier survival curves of mice infected with the indicated recombinant viruses. (E) Viral pulmonary titers of infected mice determined on day 3 and 5 post-infection (n = 3) by plaque assay. Asterisk indicates ΔNS1 not detected by plaque assay. Bars indicate standard deviation. (F) IFN bioassays measured IFN production by influenza virus-infected A549 cells. Fluorescence units represent the extent of NDV-GFP replication in Vero cells treated with supernatants from virus-infected A549 cells. Bars indicate standard deviation. The color scheme for the indicated viruses is provided at the bottom of the figure.

