
Fig. 2.
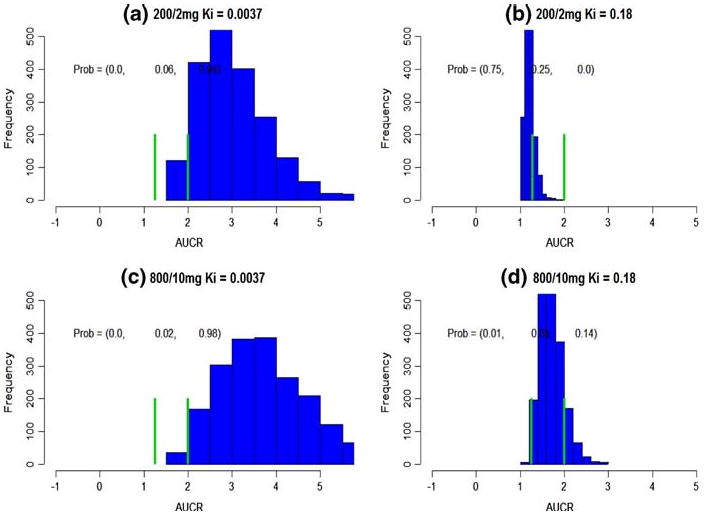
Subject-specific DDI prediction. The green bars cut the axis into three intervals, (– ∞, 1.25), (1.25, 2), (2, ∞). The probabilities on the top represent the probabilities falling into these intervals. a–d The predicted subject-specific DDI at various dose combinations and Ki