
Figure 1. Schematic representation of the metabolic pathways of trichloroethylene.
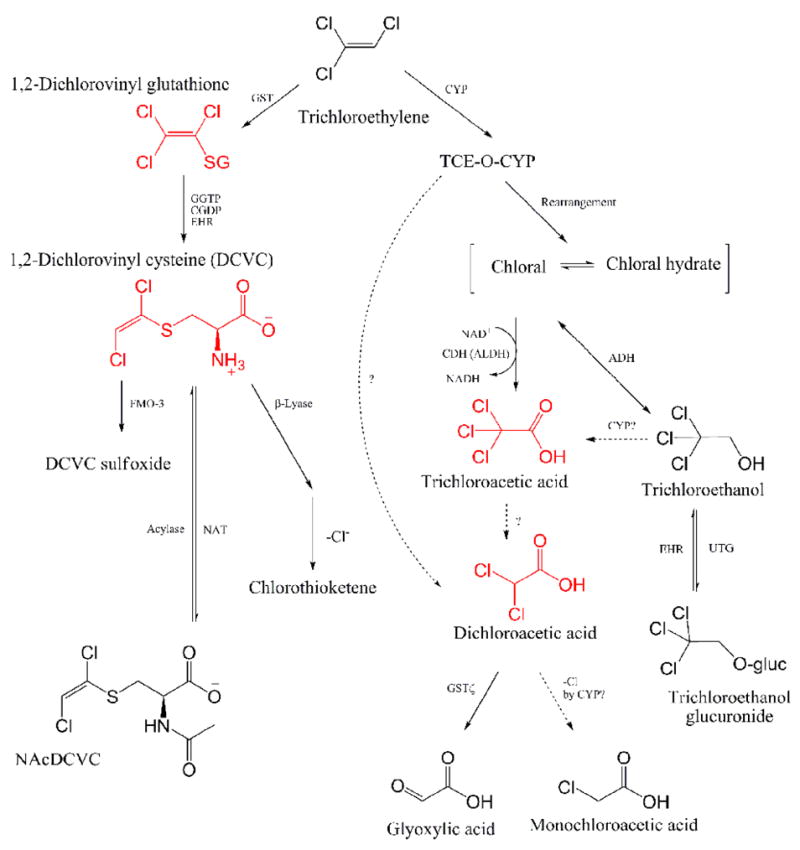
NAcDCVC, N-acetyl-DCVC; GST, glutathione S-transferase; GGTP, γ-glutamyltransferase; CGDP, cysteinyl-glycine dipeptidase; EHR, enterohepatic recirculation; FMO3, flavin monooxigenase-3; NAT, N-acetyltransferase; CYP, Cytochrom P450 enzyme; TCE-O-CYP, oxygenated TCE-CYP transition state complex; ADH, alcohol dehydrogenase; ALDH, aldehyde dehydrogenase; CDH, chloral dehydrogenase; UTG, uridine diphosphate-glucuronosyltransferase [Adaped from (Lash et al., 2000a; Schultz et al., 2002; National Research Council, 2006; Bronley-DeLancey et al., 2006; Chiu et al., 2006a)].