
Figure 5. Assessment of parameter uncertainty in model D using Monte Carlo analysis.
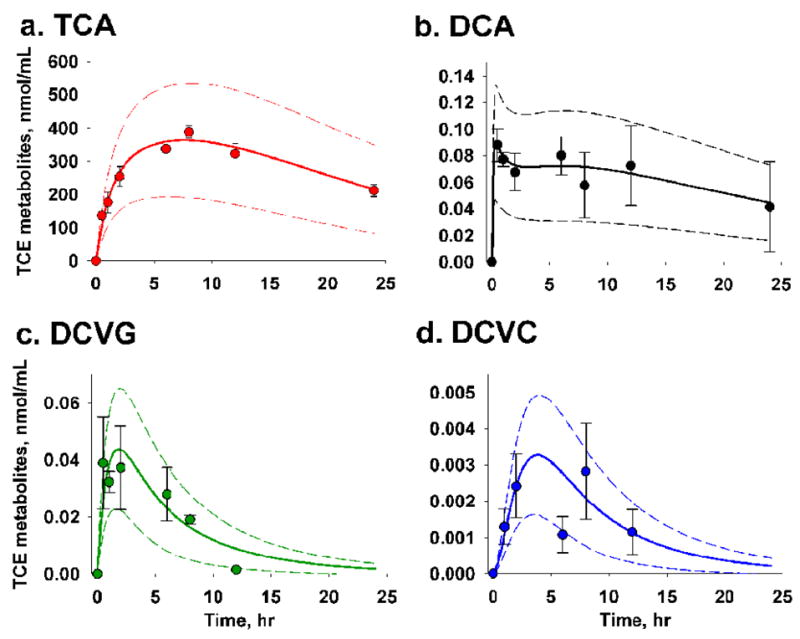
Symbol and error bar represent mean of three replicates (animals) and standard deviation of each TCE metabolite at a given time point. The middle, upper and lower boundary lines depict the mean and three-fold standard deviation from 500 random sampling given 10% relative standard deviation in all parameter estimates in the model.