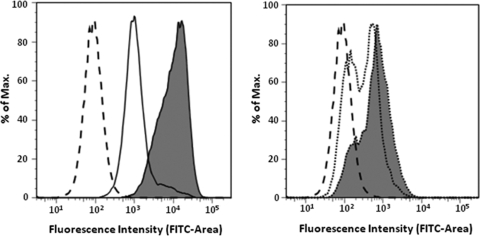
FIG. 1.
Fluorescence histogram from flow cytometry depicting the uptake of nanostructures labeled with fluorescein isothiocyanate (FITC) into J774A.1 cells. Left histogram shows uptake of N1F: cells without nanostructures (dashed line), uptake after incubation with N1F for 1 h (solid line without shading), and uptake after incubation with N1F for 4 h (solid line with shading). Right histogram shows uptake of N2F: cells without nanostructures (dashed line), uptake after incubation with N2F for 1 h (dotted line without shading), and uptake after incubation with N2F for 4 h (dotted line with shading).

