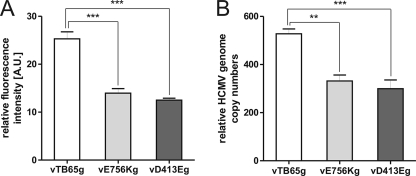
FIG. 8.
(A) Relative fluorescence intensities of vTB65g, vE756Kg, and vD413Eg viruses at day 5 postinfection. HFF were infected with the indicated viruses at an MOI of 1. Each column and error bar represent the mean ± standard deviation for at least four independent experiments. (B) Numbers of genome copies in vTB65g-, vE756Kg-, and vD413Eg-infected cells at day 5 postinfection. HFF were infected at an MOI of 1 and collected at the indicated time points. Equal inputs of virus were controlled by titration of the inocula and determination of genome copy numbers from infected cells at 48 h postinfection. The number of HCMV genome copies was determined by real-time PCR. Each column and error bar represent the mean ± standard deviation for four independent experiments.

