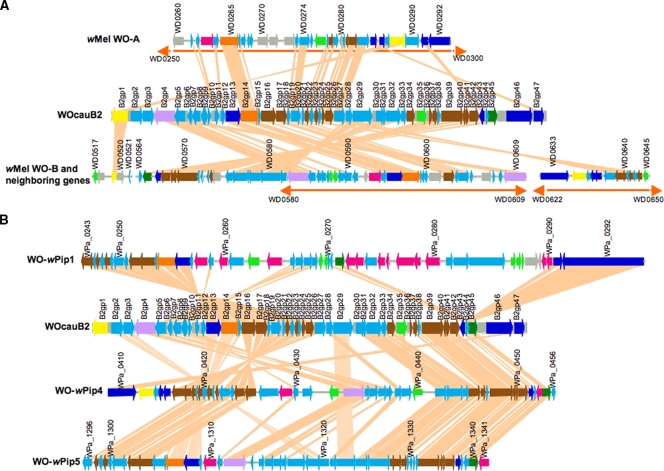
FIG. 4.
Gene order comparisons between WO prophages. (A) Comparisons between WOcauB2 and wMel prophages WO-A and WO-B. (B) Comparisons between WOcauB2 and wPip prophages WO-wPip1, WO-wPip4, and WO-wPip5. ORFs encoded in WOcauB2 were subjected to BLASTp searches against the wMel and wPip genomes, and matching ORFs with E-values less than 1e-9 are connected by tangerine lines. Orange bidirectional arrows represent the regions of wMel WO-A and WO-B assigned by Wu et al. (52). Colors of ORFs are as described in the legend of Fig. 1.

