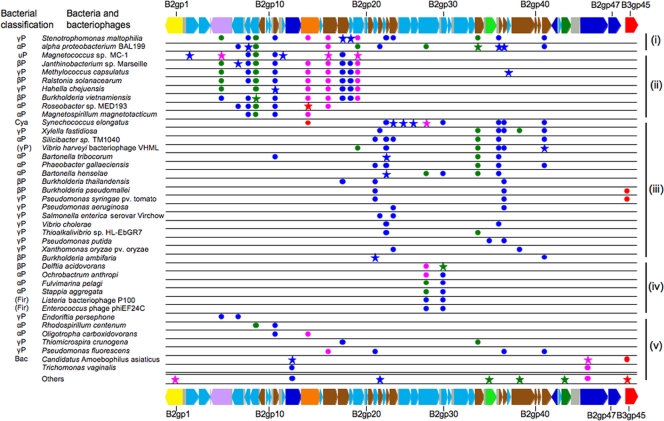
FIG. 5.
Distribution of genes allied to ORFs encoded in WOcauB2 and WOcauB3 among diverse bacterial taxa. For each of the ORFs, up to 10 top hits with E-value less than 1e-20 were collected from the databases by BLASTp searches. Stars highlight the first top hit for each of the ORFs, and circles show the other top hits. Colors of stars/circles indicate the similarity levels: blue, E-values from 1e-20 to 1e-60; green, E-values from 1e-61 to 1e-100; pink, E-values from 1e-101 to 1e-160; and red, E-values of 0. On the top and bottom are all ORFs of WOcauB2 and B3gp45 of WOcauB3 that were subjected to the database searches. For the bacterial classification at left, the following abbreviations were used: αP, the Alphaproteobacteria; βP, the Betaproteobacteria; γP, the Gammaproteobacteria; uP, the Proteobacteria, unclassified; Cya, the Cyanobacteria: Fir, the Firmicutes; and Bac, the Bacteroidetes. Parentheses show bacteriophages derived from the bacterial taxa. Note that T. vaginalis near the bottom is not a bacterium but a protozoan. On the right side are the gene detection patterns i to v as described in the text. Colors of ORFs are as described in the legend of Fig. 1.

