
FIG. 2.
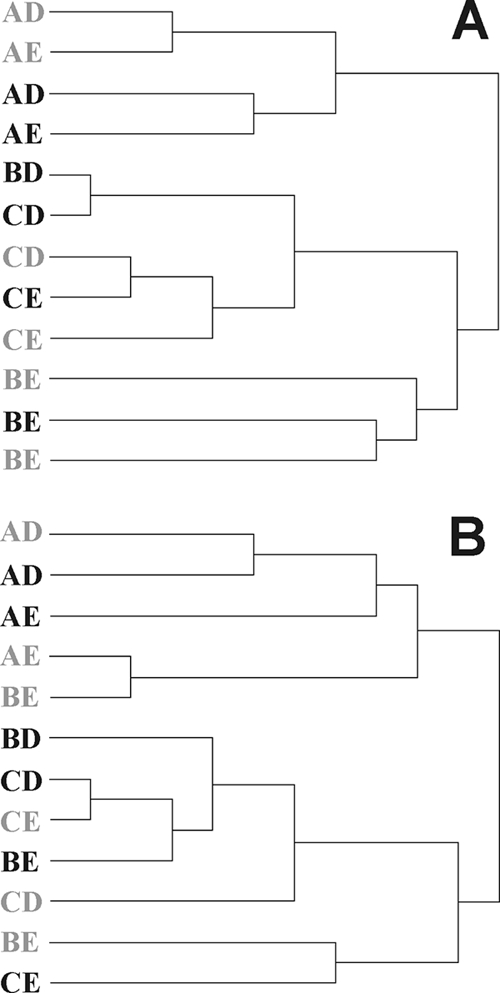
Dendrograms of the pairwise nonparametric estimates of lumen (A) and mucus (B) community structure similarity (θYC values) between various CTC-treated (gray letters) and control (black letters) pig libraries. The θYC values were calculated by SONS analysis, and the dendrograms were constructed by Ward clustering.