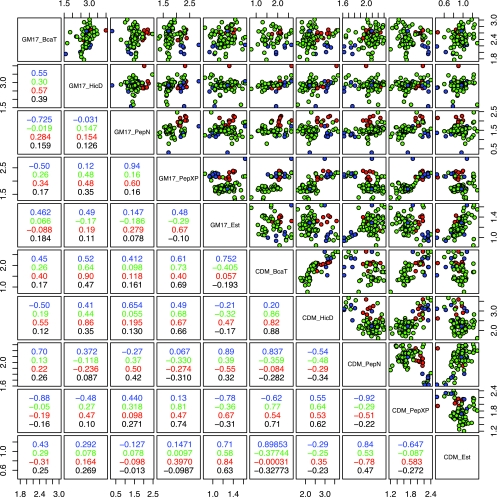
FIG. 2.
Correlation matrix and pair plots as described in the legend of Fig. 1, but strains are sorted by taxonomic position: green, L. lactis subsp. lactis; blue, L. lactis subsp. lactis biovar diacetylactis; and red, L. lactis subsp. cremoris. Analysis based on the taxonomic position of strains shows increased correlation only for some enzyme activities, but overall correlations between measurements in different environments remain poor.

