FIG. 1.
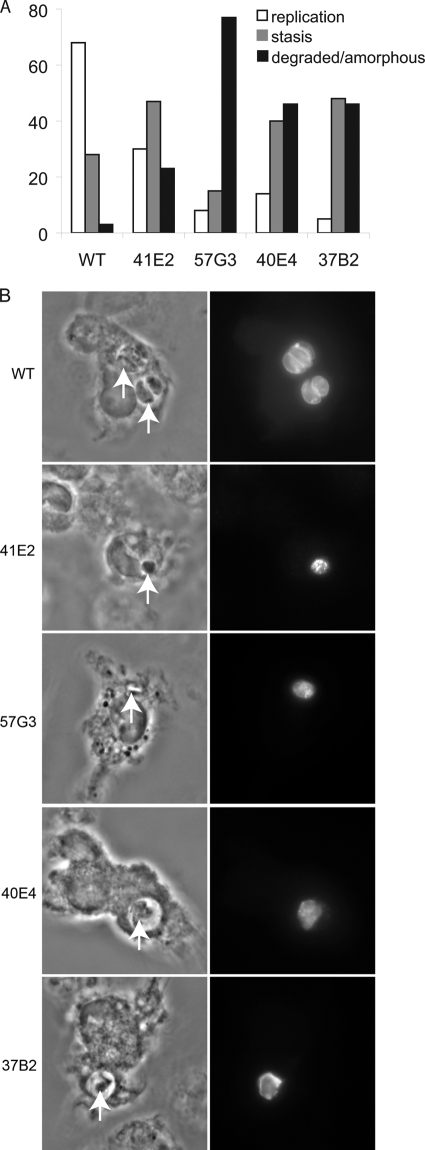
Screen of parasite mutants in macrophages activated post-parasite invasion. (A) Twenty-four hours after macrophage activation, parasites were analyzed microscopically by phase-contrast and immunofluorescence microscopy. Shown are the percentages of vacuoles that had two or four parasites per vacuole (replication), one parasite per vacuole (stasis), or a single amorphous parasite (degraded/amorphous). The majority of wild-type (WT) parasites had two to four parasites per vacuole 25 h after activation. In contrast, the majority of mutant parasites had a single parasite per vacuole that appeared either intact or amorphous. A minimum of 100 vacuoles were counted per experiment, and the experiment is representative of at least three experiments. (B) Typical images of wild-type (WT) parasites (two and four parasites per vacuole are shown) compared to the amorphous vacuoles and parasites of the mutants. Phase-contrast images are shown in the left column, and immunofluorescence images are shown in the right column. Parasites are indicated with a white arrow.

