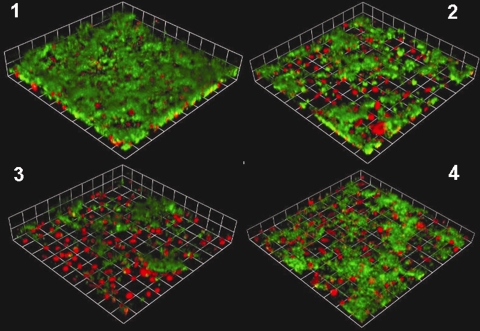
FIG. 4.
Biofilm masses over 2 days of growth for wild-type N. gonorrhoeae strain 1291 (1) and aniA::kan (2), ccp::kan (3), and norB::kan (4) insertion mutants. All four strains were visualized by GFP plasmid expression, while THCEC were visualized by Cell Tracker Orange (Molecular Probes, Invitrogen Corp., Carlsbad, CA) staining. The images are three-dimensional reconstructions of stacked z series taken at a magnification of ×200 and rendered by Volocity. These experiments were performed a minimum of three times, and representative results are shown.

