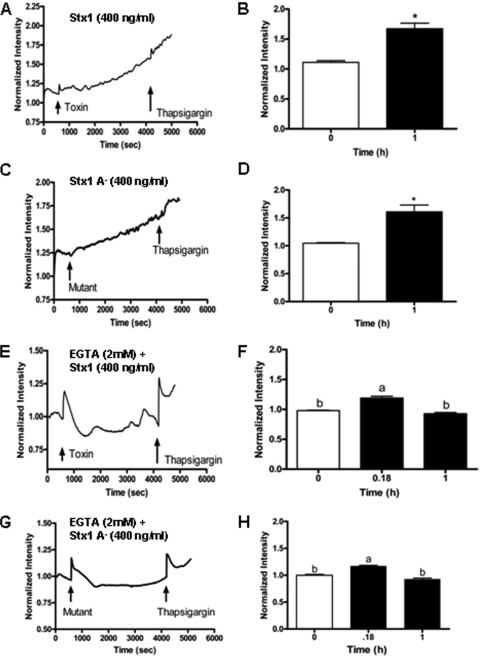
FIG. 4.
Stx1 triggers increased cytosolic Ca2+ levels in THP-1 cells. THP-1 cells were maintained in Ca2+-containing medium and then treated with the fluorescent Ca2+ indicator Fluo-5F. Basal cytosolic Ca2+ levels were determined for 10 min using the Zeiss Stallion live cell imaging system. The first arrows indicate the addition of Stx1 (A) or (C) Stx1A− to the cells. After measurement of Ca2+ levels for 1 h, thapsigargin was added to the cells (second arrows). Fluorescence intensities at 0-h time points and 1 h after Stx1 (B) or Stx1A− (D) treatments were plotted for three independent experiments. Asterisks (*) indicate statistically significant differences (P < 0.05) in cytosolic Ca2+ levels. To examine the uptake of extracellular Ca2+, THP-1 cells were maintained in Ca2+-chelated medium prior to the addition of Fluo-5F and Stx1 (E) or Stx1A− (G). Changes in intracellular Ca2+ were measured as outlined above. (F and H) Statistical analysis of differences in cytosolic Ca2+ levels at 0, 0.18, and 1 h after Stx1 or Stx1A− treatment. a, statistically significant difference (P < 0.05); b, not significant.

