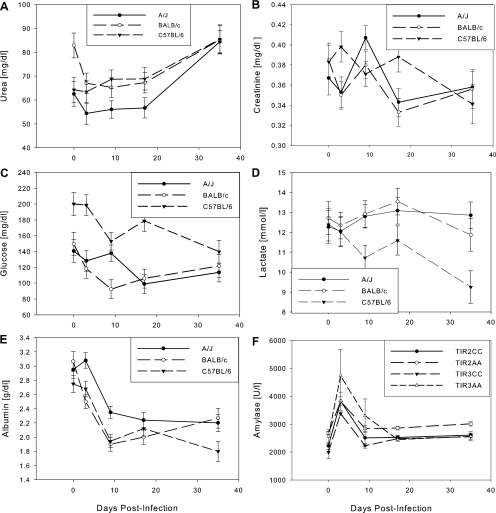
FIG. 4.
Levels of urea (A), creatinine (B), glucose (C), lactate (D), and serum albumin (E) in inbred mice and α-amylase (F) in congenic mice. Means ± standard errors are shown. Urea declined in BALB/c mice from day 0 to day 3; thereafter, all strains remained stable until day 17, after which they increased to day 35. A/J mice had lower levels at all time points. Creatinine remained within normal ranges at all time points. Both glucose and lactate declined in C57BL/6 mice over the course of the infection, but levels remained constant in the other two strains. The inverse relationship between glucose and lactate in C57BL/6 mice, compared to the other two strains, might indicate reduced glucose flux through the erythrocyte glycolysis pathway or increased gluconeogenesis in this strain. Albumin declined consistent with an acute-phase response; transferrin increased, presumably in response to the developing anemia. The differences in α-amylase between Tir2CC and Tir2AA mice and between Tir3CC and Tir3AA mice were significant. The general trend was very similar to that of the A/J parental strain (Fig. 3C).

