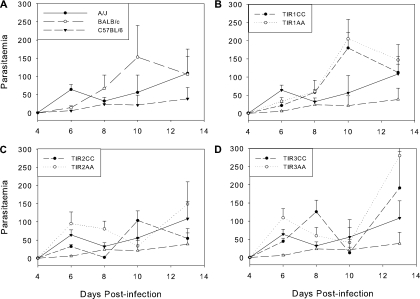
FIG. 6.
Parasitemia units in the three congenic strains compared to their controls and the inbred mice. Means ± standard errors are shown. OD, optical density. (A) Inbred strains; (B) Tir1 strains; (C) Tir2 strains; (D) Tir3 strains. The parasitemia of A/J and C57BL/6 mice is shown on each of the congenic plots with the same symbols as in panel A.

