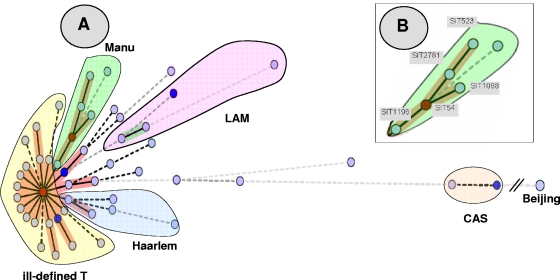
FIG. 1.
MST of potential evolutionary relationships of M. tuberculosis spoligotypes from Egypt built with Bionumerics software. Solid lines, single spacer change; dotted lines, two spacer changes (black) or more spacer changes (gray). The color of the circles is proportional to the number of clinical isolates in our study, illustrating unique isolates (sky blue) versus clustered isolates (deep blue, two to five strains; red, six strains and more). (A). As opposed to the clades belonging to the principal genetic group 1 (such as Beijing and CAS) in the MST, the Manu strains are the ones situated closest to the principal genetic group 2 or 3 lineages, such as Haarlem, LAM, and T. The central node of this unrooted tree is represented by SIT53, which is the prototype of the T1 lineage. (B). A zoom of the Manu lineage representing SIT523 (Manu ancestor), SIT2781 (Manu ancestor var_Δ33), SIT1088 (Manu2_var), SIT54 (Manu2), and SIT1196 (Manu2_var). In this scenario, the evolution is supposed to happen starting from SIT523 (Manu ancestor), which is the most conserved spoligotype in the SITVIT2 database (with positive hybridization for all 43 spacers of the DR locus) to SIT1196 (Manu2_var, with absence of consecutive spacers 33 to 35).

