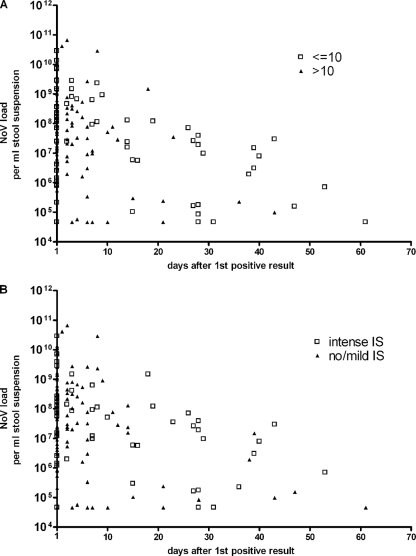
FIG. 5.
Plots of viral loads against the number of days after the first positive result, stratified by the ages (in years) (A) or immunosuppressive statuses (B) of patients. Due to log scaling, negative samples were excluded and values for samples that were positive but had viral loads below the quantification limit were calculated as half the quantification limit, i.e., 45,500 copies/ml of stool suspension. IS, immunosuppression.

