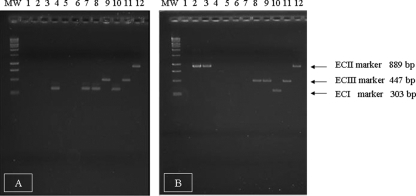
FIG. 1.
Agarose gel electrophoresis of EC markers detected in representative human isolates of L. monocytogenes. Panels A and B represent two different agarose gels. Lanes: MW (molecular weight), 1-kbp DNA ladder (Promega); 1 to 9, PCR products from human isolates analyzed in this study; 10 to 12, positive-control strains FSL J1-110 (ECI), FSL R2-499 (ECIII), and FSL N1-225 (ECII) (International Life Sciences Institute North America L. monocytogenes strain collection [11]). Genetic markers and molecular sizes corresponding to the amplified fragments are indicated on the right.

