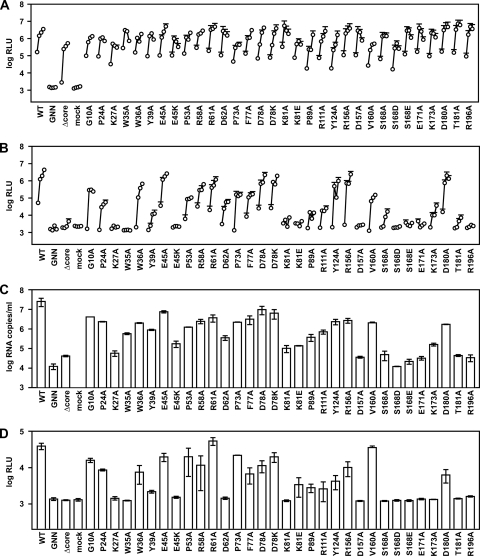
FIG. 3.
NS2 mutant phenotypes. (A) Replication of NS2 mutants. Cells were transfected with each indicated mutant, and medium was collected at 24, 48, 72, and 96 h posttransfection. Values represent the time course of secreted GLuc activity for each transfection, expressed as an average of at least three independent transfections; error bars represent the standard deviation of the mean. For legibility, only the top error bars are shown. (B) Infectivity of NS2 mutants. Relative infectivity levels in the medium from panel A were quantified by infecting naïve cells and monitoring secreted GLuc activity as in Fig. 1. (C) RNA release of NS2 mutants. The amount of HCV RNA present in the medium at 72 h posttransfection was determined by quantitative RT-PCR as described in Materials and Methods. Values represent average RNA quantities from at least three independent transfections; error bars represent the standard deviation of the mean. (D) Intracellular infectivity of NS2 mutants. Cells were lysed at 48 h posttransfection and used to infect naive cells as described in Materials and Methods. Values represent average relative infectivity measurements from at least three independent transfections; error bars represent the standard deviation of the mean.

