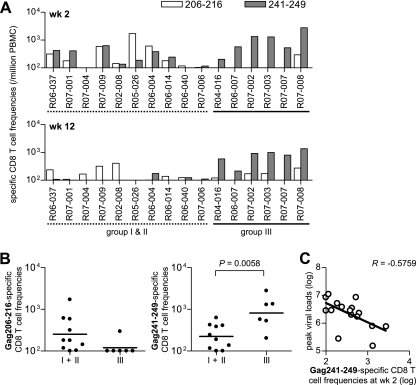
FIG. 3.
Gag epitope-specific CD8+ T-cell frequencies after a SIV challenge. (A) Frequencies of CD8+ T cells (per million PBMCs) showing Gag206-216-specific (open boxes) or Gag241-249-specific (closed boxes) IFN-γ induction in naive controls and group III macaques at week 2 (upper panel) and week 12 (lower panel). (B) Comparison of the Gag206-216-specific (left panel) or Gag241-249-specific (right panel) CD8+ T-cell frequencies in naive controls (n = 10) and group III animals (n = 6) at week 2. The bar indicates the geometric mean of each group. Frequencies of Gag241-249-specific (P = 0.0058) but not Gag206-216-specific (P = 0.0922) CD8+ T cells in group III were significantly higher than in naive controls. The Gag241-249-specific frequencies at week 12 in group III were significantly higher than those in naive controls (P < 0.0001). (C) Analysis of the correlation between Gag241-249-specific CD8+ T-cell frequencies (log) at week 2 and peak plasma viral loads (log). An inverse correlation is shown (P = 0.0196, R = −0.5759). Samples from macaques R02-007 and R06-019 in group I were unavailable for this analysis.

