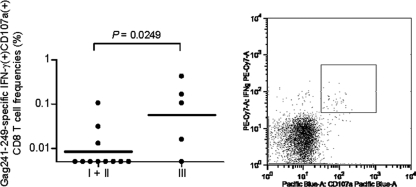
FIG. 6.
Gag241-249-specific cytolytic CD8+ T-cell frequencies at week 2 after a challenge. PBMCs were cultured in the absence or the presence of the Gag241-249 peptide for unstimulated controls or Gag241-249-specific stimulation, and the frequencies of CD8+ T cells exhibiting Gag241-249-specific induction of both IFN-γ and CD107a in the total CD8+ T cells were examined. The bar indicates the geometric mean of each group. The frequencies in group III were significantly higher than those in naive controls (P = 0.0249 by unpaired t test). The right panel is a representative dot plot showing the CD107a (x axis) and IFN-γ (y axis) responses in CD8+ T cells in macaque R07-008 after Gag241-249-specific stimulation. Samples from macaques R06-019 in group I and R07-007 in group III were unavailable for this analysis.

