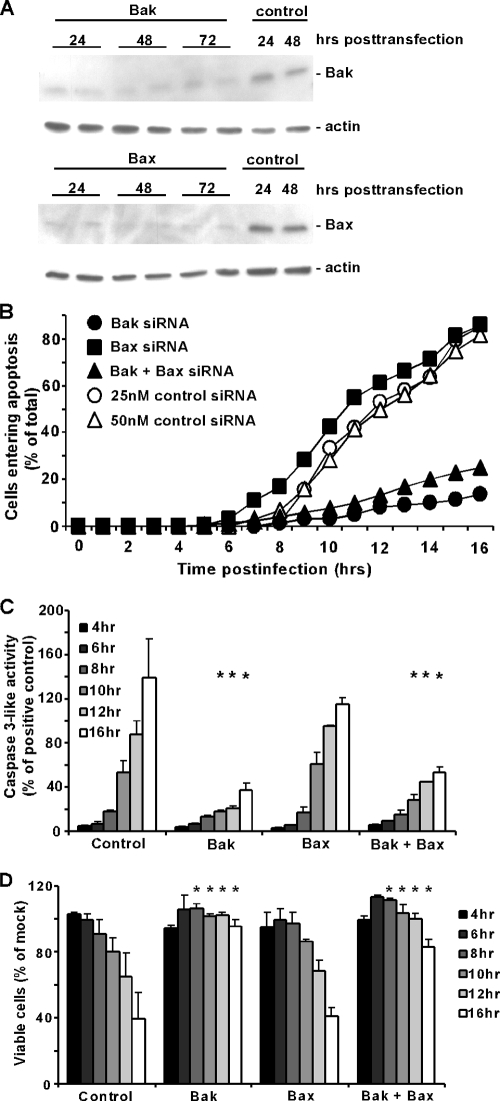
FIG. 1.
rwt virus induces apoptosis more slowly in HeLa cells lacking Bak than in those lacking Bax. (A) HeLa cells were transfected with 25 nM Bak, Bax, or nontargeting siRNA as a control. At the indicated times posttransfection, cell lysates were analyzed by immunoblotting with antibodies for Bak, Bax, and actin as a loading control. Cells transfected with Bak or Bax siRNA were analyzed in duplicate. (B) HeLa cells were transfected with 25 nM Bak siRNA, Bax siRNA, and Bak and Bax siRNA, 25 nM nontargeting siRNA as a control for single transfection, and 50 nM nontargeting siRNA as a control for double transfection. At 48 h posttransfection, cells were infected with rwt virus and analyzed by time-lapse microscopy. The cumulative percentage of cells entering apoptosis was determined as the number of cells that underwent apoptotic membrane blebbing and is plotted as a function of time postinfection. The data represent the average of three experiments, which collectively analyzed the time of onset of apoptosis in 120 to 200 total cells. Bak siRNA and Bak plus Bax siRNA data were significantly different from control and Bax siRNA data (P < 0.05) by log rank analysis. In subsequent assays, only one control is shown, as the data are almost identical. (C) Caspase-3-like activity was assayed in HeLa cells transfected for 48 h with the same siRNAs as described above and then infected with rwt virus for the times indicated. Cells were lysed, and caspase-3 activity in cell lysates was measured with a fluorogenic substrate (DEVD-AFC). Data are expressed in arbitrary fluorescence units per microgram of total protein and normalized to the maximum value expressed by HeLa cells incubated with SSP (as a positive control) for 12 h. The data represent the average results ± standard deviations from three experiments. (D) Cell viability was analyzed with an MTT assay. HeLa cells were transfected and infected, as described above. At the indicated times, MTT was added to each sample for 4 h, at which point a solubilization solution was added. Samples were analyzed with an ELISA plate reader. Cell viability was determined as a percentage of a transfected, uninfected control. The data represent the average results ± standard deviations from three experiments (*, P < 0.05 compared to control).

