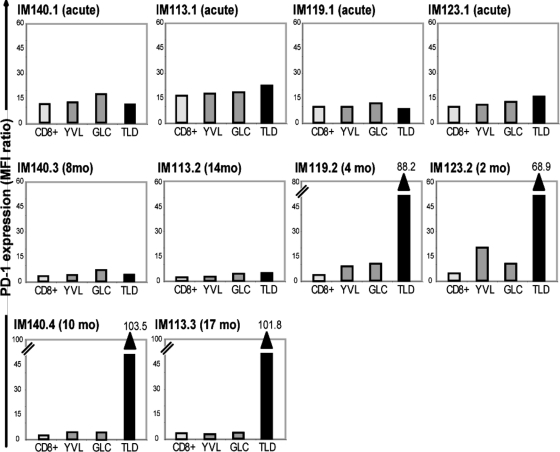
FIG. 5.
Histograms showing levels of PD-1 expression on total CD8+ T cells and on the YVL, GLC, and TLD epitope-specific populations in PBMCs from patients IM140, IM113, IM119, and IM123 during acute IM and at later times. Results are expressed as MFI ratios as described in the legend to Fig. 4. Note that the IM140.4, IM113.3, IM119.2, and IM123.2 samples are the last samples obtained in which a TLD-specific response was detectable; where PD-1 staining on TLD-specific cells exceeds the vertical scale, the actual MFI ratios for these TLD-specific populations are shown above the relevant columns. In a comparison of values from the last available blood sample in which all three epitope-specific populations were detectable for the four patients analyzed, the difference between PD-1 expression on TLD-specific and YVL/GLC-specific cells was significant (P = 0.028).

