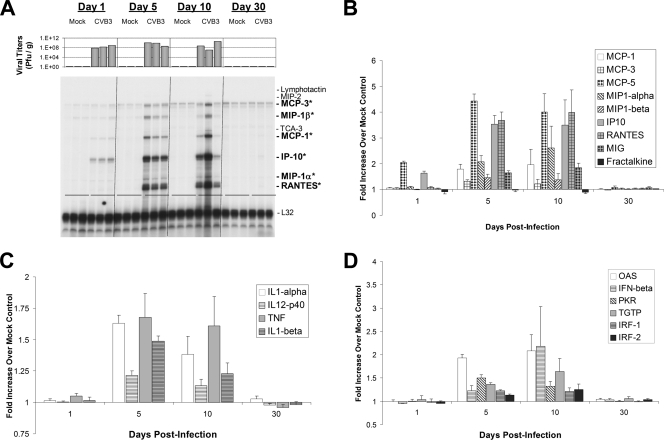
FIG. 2.
Quantitative analysis of chemokines, cytokines, and type I IFN response gene expression levels in the neonatal CNS over time. One-day-old BALB/c pups (three mice per time point) described in the legend of Fig. 1 were evaluated for chemokine gene expression by RNase protection assay on days 1, 5, 10, and 30 p.i. (A) Each sample lane of the autoradiographic film represents chemokine gene expression levels from a single mouse. Three mock-infected and three infected animals were analyzed per time point. Viral titers (PFU/g) for each mouse are depicted above each sample lane. Nine chemokines were analyzed for gene expression levels (lymphotactin, MIP-2, MCP-3, MIP-1β, TCA-3, MCP-1, IP-10, MIP-1α, and RANTES). Six of nine chemokines (MCP-3, MIP-1β, MCP-1, IP-10, MIP-1α, and RANTES, indicated by boldface with asterisks) were upregulated specifically within infected animals as late as 10 days p.i. However by day 30 p.i., chemokine gene expression levels returned to levels observed in mock-infected animals. The ribosomal gene L32 was probed to demonstrate equal loading of cellular RNA per lane. Band intensities evaluated for chemokine (B), cytokine (C), and type I IFN (D) gene expression by RPAs were calculated using ImageJ software (NIH public domain software), and arbitrary units were determined after compensating for RNA levels utilizing the housekeeping ribosomal gene, L32. Expression levels (in triplicate) were graphed as a relative increase over mock-infected controls. Standard error bars are shown for each sample. (B) As illustrated in panel A, chemokines were induced to high levels relative to mock-infected animals at days 5 and 10 p.i In particular, high levels of MCP-5 and IP10 were observed as early as 24 h p.i. (C) Inflammatory cytokines, including TNF, were induced at days 5 and 10 p.i. (D) Many type I IFN response genes, including IFN-β, were induced 5 and 10 days following infection. By 30 days p.i., chemokine, cytokine, and type I IFN response gene expression returned to levels seen in mock-infected control mice. Error bars represent the standard deviation for each group.

