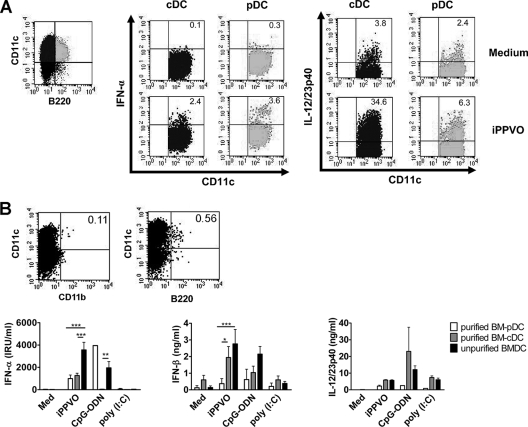
FIG. 2.
iPPVO-induced IFN-α and IL-12/23p40 production by BM-pDC and BM-cDC. (A) Flt3L-generated BM-cDC (cDC; upper left quadrant, black) and BM-pDC (pDC; upper right quadrant, gray) were stimulated for 12 h with medium or iPPVO (MOI = 5) and analyzed for intracellular IFN-α and IL-12/23p40 synthesis by flow cytometry. The numbers in the upper right corners indicate the proportion of IFN-α+ (left) and IL-12/23p40+ (right) cells. Quadrants were set according to the isotype control staining; all background staining signals were below 0.2% (data not shown). (B) Prior to stimulation with iPPVO (MOI = 5), Flt3L-generated BM-cDC and BM-pDC were purified by depleting contaminating cells with magnetic beads. The numbers in the upper right corners indicate the percentages of contaminating CD11b+ BM-cDC in purified BM-pDC (left) and of contaminating B220+ BM-pDC in purified BM-cDC (right) after the depletion procedure. The results of one of two independent experiments are shown (top panels). The cell numbers were adjusted to 5 × 10⁵ cells/ml. After stimulation for 24 h, cell culture supernatants were analyzed for IFN-α, IL-12/23p40, and IFN-β by sandwich ELISA. Each column represents the mean ± the SEM of at least duplicate cultures. Pooled data of two independent experiments are shown (bottom panels). *, P < 0.05; **, P < 0.01; ***, P < 0.001.

