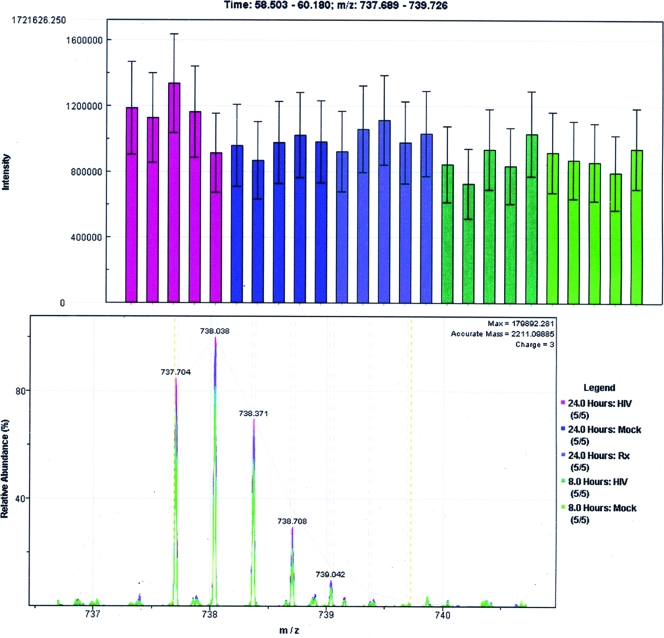
FIG. 4.
Quantification of trypsin autolysis product. Isotope group ion intensities of the trypsin autolysis product LGEHNIDVLEGNEQFINAAK are presented. (Top) Histogram of corresponding ion currents from the 25 LC-MS/MS runs; error bars correspond to 1 standard deviation. Although pairwise t tests were performed, with the average value from the 24 h p.i. mock-infected samples serving as a common reference, no significant difference (P < 0.05) was detected among the 25 runs. (Bottom) Overlaid mass spectra for the same peptide, colored based on treatment conditions as shown at the bottom right, showing all peaks in the isotope group.

