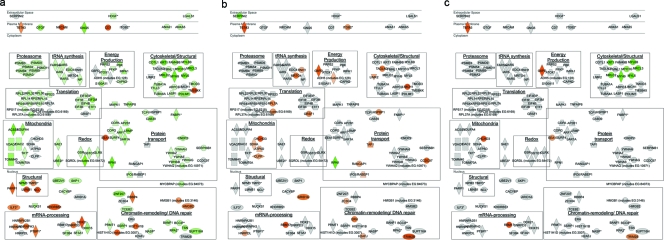
FIG. 8.
Subcellular and functional distributions of signature proteins. Shown are signature proteins (n = 168) on the basis of subcellular distribution as registered in the Ingenuity Pathway Analysis database. Individual proteins are annotated with Human Genome Organization Gene Nomenclature Committee gene symbols; the red and green shading corresponds to up- and downregulation, respectively. Gray indicates no differential regulation detected. Shown here are differential expression results from (a) 24 h p.i., (b) 8 h p.i., and (c) 24 h p.i. in the presence of 10 μM efavirenz. Proteins corresponding to similar functions are grouped in boxes as labeled; functions are deduced from Ingenuity Pathway Analysis and Gene Ontology annotations, as well as a literature review.

