FIG. 1.
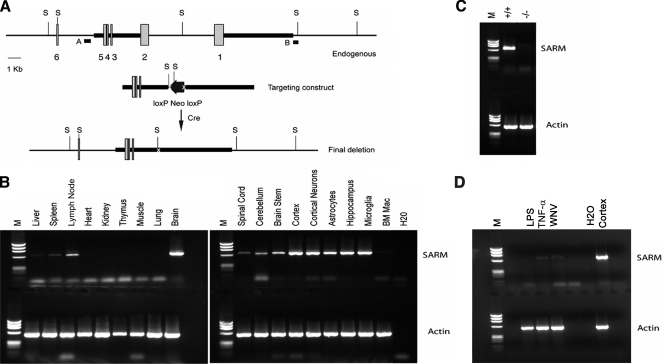
Expression and generation of SARM knockout mice. (A) Schematic of the SARM locus and targeting cassette. Exons 1 through 6 of SARM are represented by gray boxes, and the fragments included in the targeting construct by a heavy black line. The locations of external probes are shown, as are the restriction sites used for screening. S, SphI. (B) A representative image of the RT-PCR analysis of SARM mRNA from whole organs, specific brain regions, and primary cells derived from wild-type C57BL/6 mice is shown. The SARM transcript, at approximately 650 bp, is indicated; a 519-bp fragment of β-actin was amplified in parallel as a control. BM Mac, bone marrow-derived macrophages. (C) A representative image of the RT-PCR analysis of SARM−/− and wild-type mouse mRNA is shown. SARM and β-actin mRNA were amplified from equivalent amounts of mRNA derived from wild-type, SARM+/−, and SARM−/− astrocytes. (D) A representative image of RT-PCR analysis of SARM mRNA in macrophages activated with LPS and TNF-α or infected with WNV is shown. Cerebral cortex mRNA was used as a positive control. M, molecular size ladder.

