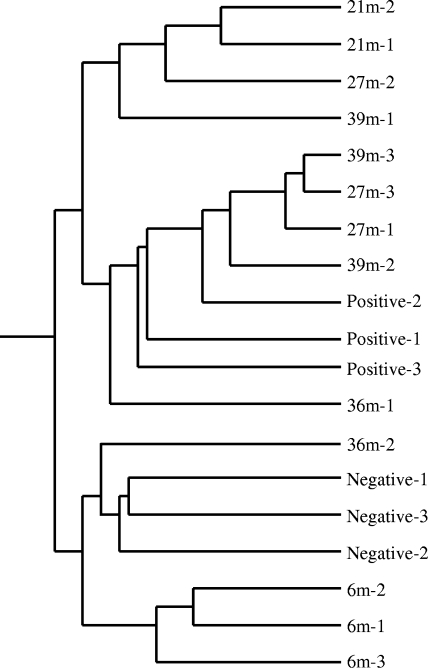
FIG. 1.
Condition tree of clustering analysis for BSE time course samples. The analysis was performed by GeneSpring using all 24,128 genes (probe sets) on Affymetrix bovine microarray GeneChips. Similarity was measured using the Spearman correlation with a value of 1 for the separation ratio and a value if 0.001 for the minimum distance to merge similar branches. Three positive-control animals (Positive-1, -2, and -3) and three negative-control animals (Negative-1, -2, and -3) were used in the study. 21m-2, sample from 21 mpi from animal 2.

