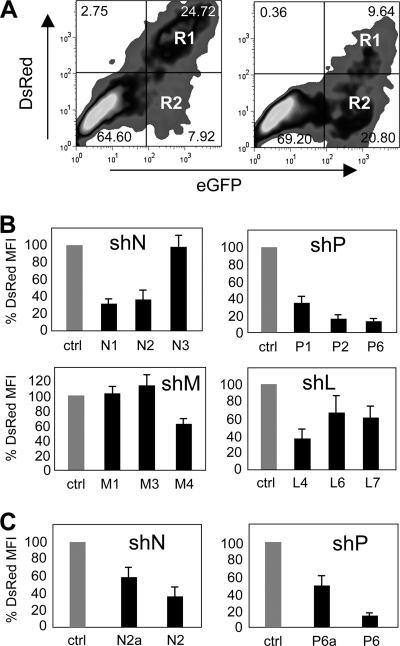
FIG. 2.
Flow cytometry analysis of 293T cells cotransfected with the pDsRed2-stopN, -P, -M, and -L indicator and corresponding F6GW-based MV-specific shRNA-expressing plasmids. (A) 293T cells transfected with pDsRed2-stopN and F6GW expressing control shRNA (left panel) and 293T cells transfected with pDsRed2-stopP and F6GW expressing shP6 (F6GW-P6-EGFP) (right panel). The percentages of cells in each region are shown. (B) 293T cells were cotransfected with the pDsRed2-stop indicator plasmids containing the cDNAs for N, P, M, and L and the F6GW vector expressing control shRNA or the corresponding MV-specific shRNAs (n = 5). Results are presented as percentages of the MFI of control shRNA. (C) The shRNAs with point mutations (N2a and P6a) in comparison to the 100% homologous shRNAs (N2 and P6) show a reduced inhibitory effect.

