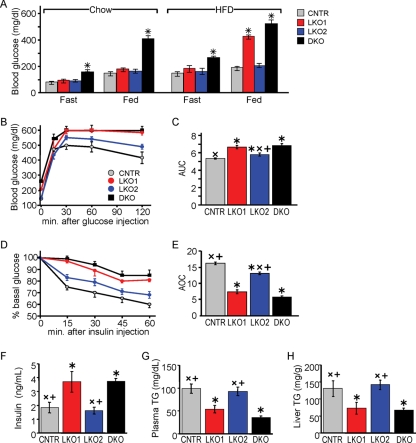
FIG. 6.
Nutrient homeostasis in HFD-fed LKO1 and LKO2 mice. (A) Blood glucose concentrations (average ± SEM; n = 6) determined after 16 h fast with or without 4 h of refeeding in 4-month-old male CNTR, LKO1, LKO2, and DKO mice fed chow or an HFD. (B and C) Glucose tolerance test results for 4-month-old overnight-fasted mice (n = 6 per group); the results were summarized by determining the area under each curve (AUC), using Medcalc (v10). (D and E) Insulin tolerance test results for nonfasted 4-month-old male mice (n = 6); the results were summarized as the average area between 100% and each curve (AOC), determined using Medcalc. Fasting plasma insulin and triglyceride (TG) concentration (F and G), and liver triglyceride content (H) determined after 12 weeks of HFD feeding (n = 6). One-way ANOVA was used to compare the groups. *, P < 0.05 versus CNTR mice; ×, P < 0.05 versus DKO mice; +, P < 0.05 versus LKO1 mice.

