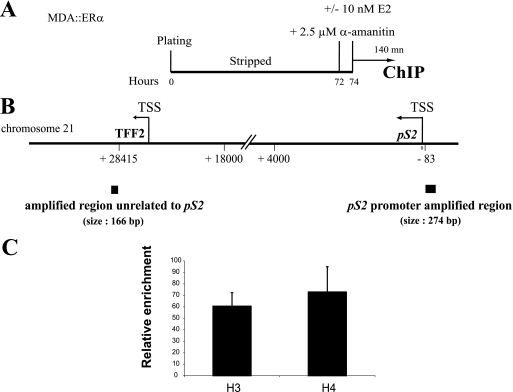
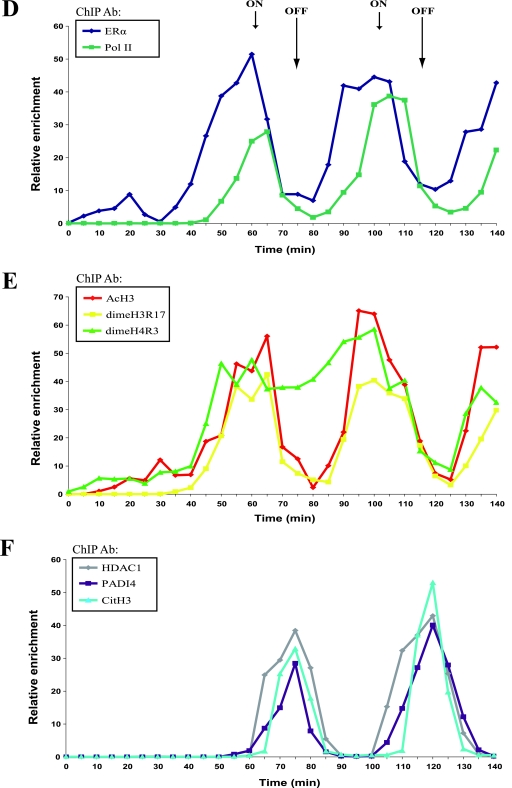
FIG. 4.
Cyclic binding of HDAC1 and PADI4 to the pS2 promoter. (A) Schematic description of kinetic ChIP assays performed on MDA::ERα cells. The cells were synchronized by 3 days of culture and then treated with 2.5 μM α-amanitin for 2 h, followed by exposure to 10 nM E2. Chromatin was then prepared from cells sampled at 5-min intervals over a 140-min period. (B) Locations of the control and pS2 promoter regions on which ChIP experiments focused. Transcription start sites (TSS) of the pS2 gene and upstream TFF2 gene are shown, as is the unrelated amplified control region. (C) ChIP assays showing enrichment in histones H3 and H4 in the unrelated control region were performed. Chromatin samples from MDA::ERα cells were immunoprecipitated with antibodies raised against histone H3 or histone H4. The amount of immunoprecipitated unrelated control region was quantified by real-time PCR, and determined on the basis of the threshold cycle (i.e., the CT value) for each PCR. Calculation details are described in Materials and Methods. The final relative enrichment values shown are means of three separate experiments. (D) A chromatin sample as depicted in panel A was subjected to immunoprecipitation with antibodies raised against ERα and RNA Pol II. The amount of immunoprecipitated pS2 promoter was quantified by real-time PCR and determined on the basis of the threshold cycle (CT) for each PCR. Calculation details are described in Materials and Methods. The final relative enrichment values shown are means of three separate experiments. (E) Chromatin samples were subjected, as depicted in panel A, to immunoprecipitation with anti-AcH3, anti-dimeH3R17, or anti-dimeH4R3. The amount of immunoprecipitated pS2 promoter was quantified by real-time PCR. The relative enrichment values shown are means of three separate experiments. (F) Kinetic ChIPs indicate that PADI4 and HDAC1 are recruited to the pS2 promoter within the same time-frame. Chromatin samples were subjected, as depicted in panel A, to immunoprecipitation with antibodies raised against HDAC1, PADI4, or CitH3 [H3R(17+2+8) citrullinated]. The amount of immunoprecipitated pS2 promoter was evaluated on the basis of the threshold cycle (CT) for each PCR (see reference 20 and Materials and Methods for details). The relative enrichment values shown are means of three separate experiments.


