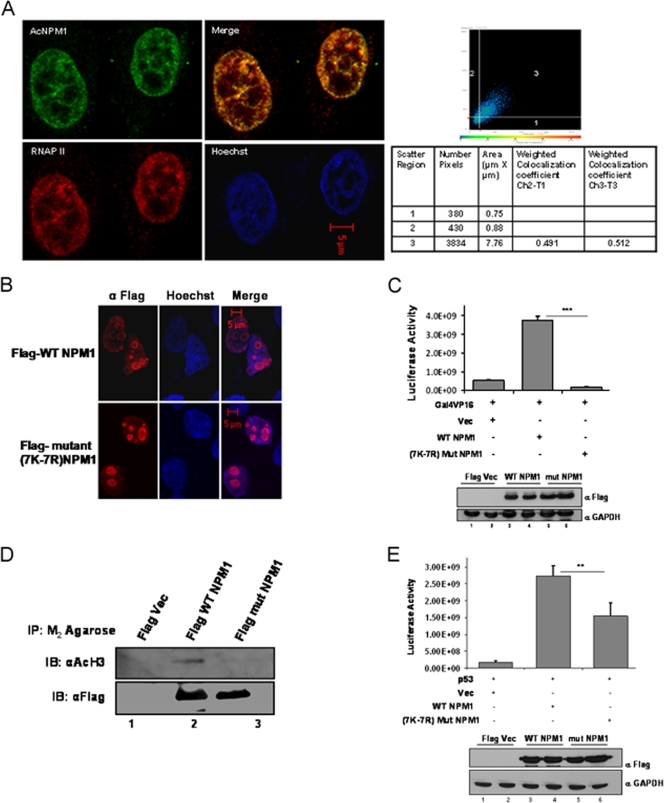
FIG. 2.
Acetylated NPM1 colocalizes with RNAP II. (A) Interphase cell nuclei stained with anti-AcNPM1 (green) and anti-RNAP II (red) antibodies. A merged coimmunofluorescence image is shown. DNA staining with Hoechst is blue. The scatter plot denotes weighted colocalization coefficient measurements of the coimmunofluorescence image of AcNPM1 with RNAP II. (B) Immunofluorescence image illustrating the predominant nucleolar localization of both the Flag-tagged WT and 7K-7R mutant NPM1 proteins stained with anti-Flag antibody at 48 h posttransfection in HEK293T cells. DNA was stained with Hoechst (blue). Scale bar, 5 μm. (C) A Gal4-VP16-responsive luciferase assay (pG10luc) was performed with 1 μg of the Flag vector (Vec) alone (lane 1), Flag-tagged WT NPM1 (lane 2), or Flag-tagged 7K-7R mutant NPM1 (lane 3) in HEK293T cells transiently transfected with pG10luc (100 ng), Gal4-VP16 (10 ng), and pCMV-gal (100 ng). Values are means ± standard deviations of triplicates. The data were analyzed by paired t test (***, P < 0.001). Equal expression levels of both the WT and 7K-7R mutant NPM1 proteins of a replicate experiment are depicted by Western blotting with anti-Flag antibody (Sigma). GAPDH, glyceraldehyde-3-phosphate dehydrogenase. (D) An anti-Flag (M2-agarose) pulldown assay was performed with HEK293T cells transfected with either Flag-tagged WT NPM1 or Flag-tagged 7K-7R mutant NPM1. Flag vector-transfected cells were used as a negative control. Following immunoprecipitation, immunoblotting (IB) was done with anti-acetylated histone H3 antibody (AcH3; Calbiochem). Western blotting with anti-Flag antibody was done to show the presence of almost equal amounts of Flag-tagged WT and 7K-7R mutant NPM1 proteins in the pulldown complex. (E) A p53-responsive luciferase assay (pG13luc) was performed with 1 μg of the Flag vector alone (lane 1), Flag-tagged WT NPM1 (lane 2), or Flag-tagged 7K-7R mutant NPM1 (lane 3) in HEK293T cells transiently transfected with pG13luc (100 ng), p53 (10 ng), and pCMV-gal (100 ng). Values are means ± standard deviations of triplicates. The data were analyzed by paired t test (**, P < 0.01). Similar expression levels of both the WT and 7K-7R mutant NPM1 proteins in a replicate experiment are depicted by Western blotting with an anti-Flag antibody.

