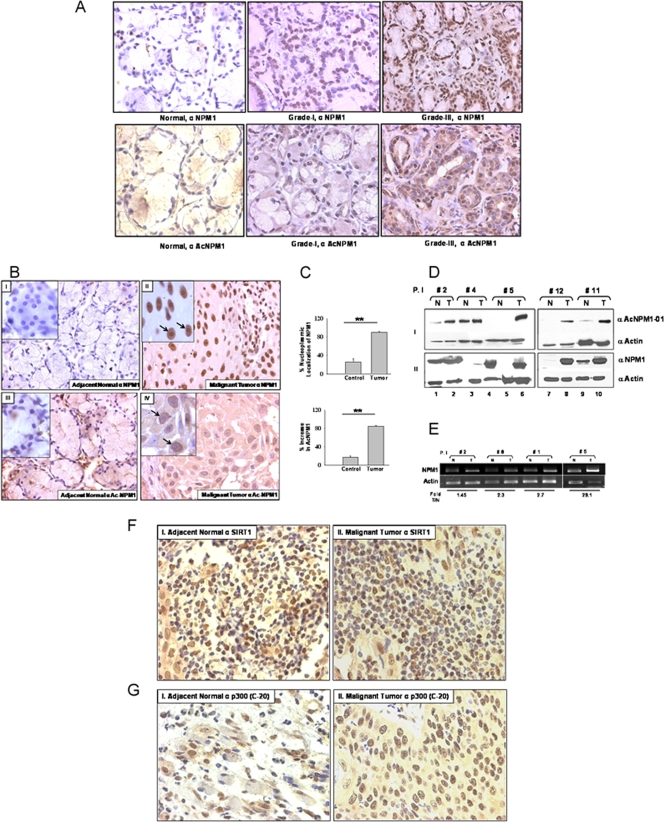
FIG. 4.
NPM1 is overexpressed and is predominantly acetylated in grade II OSCC. (A) Representative images of an IHC analysis performed with normal oral tissue and grade I and III oral tumor samples with an anti-NPM1 antibody (upper panel) and an anti-AcNPM1 antibody (lower panel) at ×40 magnification. (B) Representative images of IHC analysis of malignant oral tumor and adjacent normal tissues done with anti-NPM1 antibody at ×40 magnification (panels II and I, respectively). Similarly, IHC analysis was done with an anti-AcNPM1-01 antibody (panels IV and III, respectively). A higher magnification (×100) of the same region is included (inset). Nucleoli are indicated by arrows. (C) A paired t test was plotted for mean difference in the intensity of nucleoplasmic NPM1 observed in normal versus tumor tissue samples from 12 oral cancer patients (upper graph) and similarly for the increase in acetylated NPM1 levels (lower graph) (**, P < 0.01; n = 5). (D) Acetylated NPM1 (panel I) and NPM1 (panel II) were compared in paired patient samples by Western blot analysis. Expression of β-actin was used as a loading control. P.I, patient identification number; N, adjacent normal tissue; T, malignant oral tumor tissue. (E) Real-time RT-PCR analysis of NPM1 transcripts in paired samples from oral cancer patients with a corresponding β-actin control. Fold T/N denotes the n-fold NPM1 expression increase in tumor versus normal tissue. (F) IHC analysis of malignant oral tumor and adjacent normal tissues was done with anti-hSIRT1 antibody and imaged at ×40 magnification (panels I and II, respectively). (G) IHC analysis of malignant oral tumor and adjacent normal tissues was done with anti-p300-C-20 antibody (panels I and II, respectively) and imaged at ×40 magnification. The data were analyzed by paired t test (*, P < 0.05).

