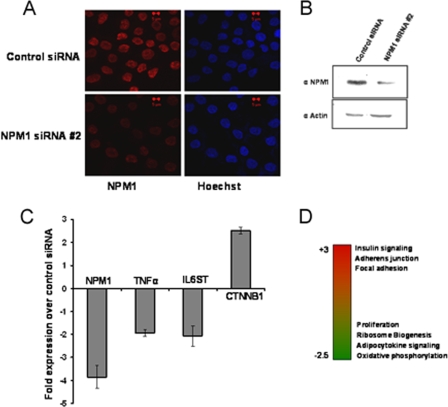
FIG. 5.
Knockdown of NPM1 results in altered expression of genes involved in carcinogenesis. (A) KB cells stained with anti-NPM1 antibody after 48 h of NPM1 siRNA no. 2 transfection. Scale bar, 5 μm. (B) Western blot analysis of NPM1 after 48 h of NPM1 siRNA no. 2 transfection. Expression of β-actin was used as a loading control. (C) Real-time quantitative RT-PCR analysis of gene expression upon siRNA-mediated knockdown of NPM1 in KB cells. The changes in the transcript levels of selected genes upon NPM1 siRNA transfection over those in the control are plotted as graphs. Internal normalization was done with β-actin levels. Values are means ± standard deviations of three independent NPM1 siRNA transfections. (D) Heat map depicting differential regulation of cellular pathways upon NPM1 knockdown. Red indicates upregulated genes, and green denotes downregulated genes.

