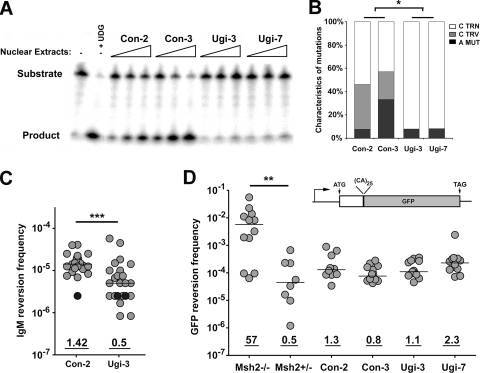
FIG. 3.
Expression of UNG inhibitor UGI in R67 cells reduces both A·T mutations and C transversion mutations. (A) The level of UNG activity in control and UGI-expressing Ramos clones was determined using a substrate cleavage assay. A substrate containing a single U:G mismatch was incubated alone (lane 1), with uracil DNA glycosylase (lane 2), or with 3× serial dilutions of nuclear extracts from two control (lanes 3 to 8) and two UGI-expressing (lanes 9 to 14) R67 clones. TRN, transition; TRV, transversion; MUT, mutation. (B) Mutation characteristics in the V region of control (left) and UGI-expressing (right) R67 clones are shown. Statistical analyses comparing mutation types were performed using the t test (the asterisk indicates P = 0.0150 for G·C transition mutations and P = 0.0492 for G·C transversion mutations). TRN, transition; TRV, transversion; MUT, mutation. (C) The IgM reversion frequency was determined using the ELISPOT assay for IgM secretion. Individual subclones are represented as light gray circles; black circles represent clones in which no IgM reversion events were observed among ∼5 × 10⁻⁵ cells. Statistical analyses comparing median reversion frequencies were performed using the Mann-Whitney test (***, P = 0.0007). (D) MMR activity for Msh2−/− and Msh2+/− pre-B cell lines and R67 clones was quantified using a microsatellite instability assay based on the GFP reversion frequency. The GFP open reading frame is interrupted with an out-of-frame dinucleotide microsatellite-like sequence (39), and microsatellite instability can lead to GFP expression. Statistical analyses were performed using the Mann-Whitney test (**, P = 0.003 for results with Msh2−/− pre-B cells compared to those with Msh2+/− pre-B cells).

