
FIG. 5.
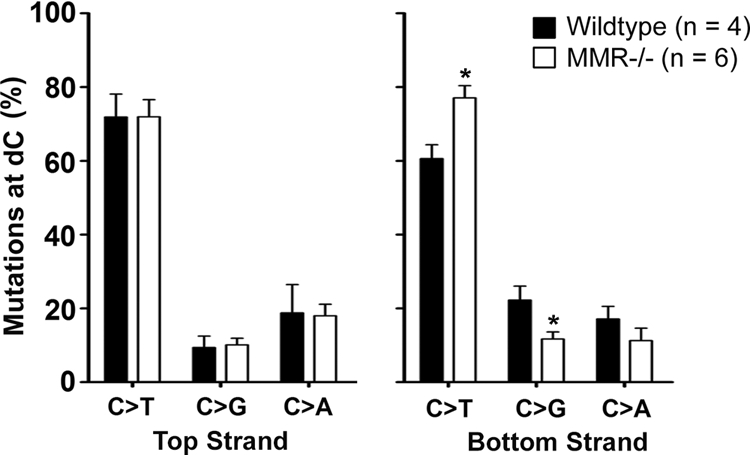
Bottom, but not top, strand C transversion mutations are reduced in MMR-deficient mice. The percentages of C-to-T, C-to-G, and C-to-A mutations on the top strand (left) and on the bottom strand (right) in wild-type and MMR-deficient mice is displayed. Data were collected from the JH2-JH4 region of wild-type (two Msh2G674A+/+, one Msh2G674A+/M, and one Exo1+/−) and MMR-deficient (one Msh2−/−, one Exo1−/−, one Msh6−/−, and three Msh2G674AM/M) mice from previous publications (see Fig. S4 in the supplemental material). Statistical analyses were performed using the t test (the asterisk indicates P = 0.0250 for C to T mutations on the bottom strand and P = 0.0121 for C to G mutations on the bottom strand).